At market close in early March 2026, benchmark primary aluminum traded around USD 3,200–3,400 per metric ton, which equals roughly USD 1.45–1.55 per pound; regional delivery, grade, contract terms, taxes, and freight frequently move that figure by ±0.05–0.25 per pound, so pragmatic buyers should plan on a short-run working price band near USD 1.35–1.70 per pound while using contract hedges and quality-driven sourcing to capture lower landed costs.
If you need flux for aluminum casting, ceramic foam filter, degassing filter equipment, you can contact us for free quotation.
1. How aluminum ingot pricing is defined
Prices used in trade fall into a small number of conventions:
-
Benchmark base: most global quotations and derivatives reference the benchmark quoted on the London Metal Exchange. That benchmark is expressed in USD per metric ton. Market commentary and term-contracts typically reference an LME cash, 3-month, or spot-equivalent price.
-
Common physical units: metric tons (mt or t) and kilograms in bulk markets; retail and some domestic quotations often show price per pound. 1 metric ton equals 2,204.6226 pounds. Use that fixed conversion to move between units.
-
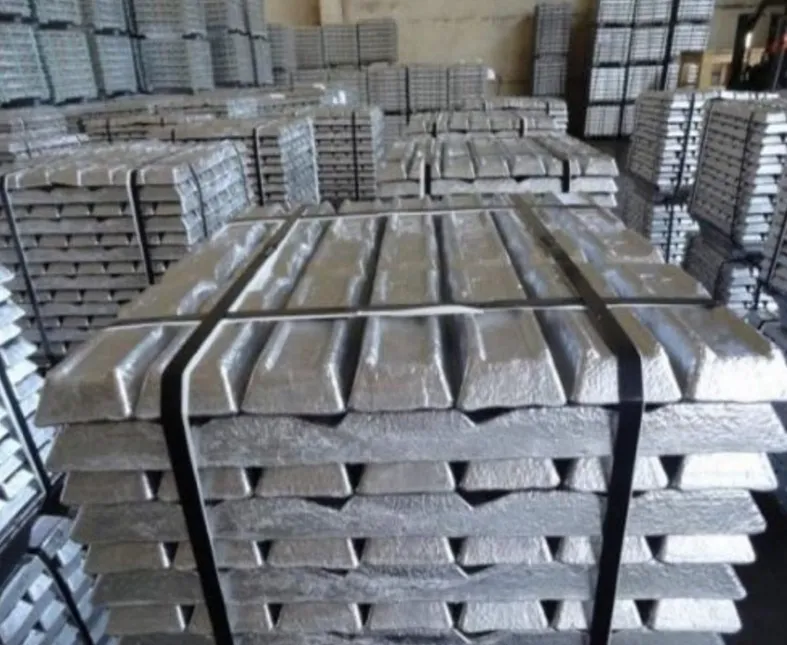
Grades and forms: “primary ingot” or “A00/AL99.7” is typical for high-purity primary metal; cast alloys such as ADC12 or IA10 are sold at different premia; P1020 shows up in India. Grade, tolerance, and ingot/billet geometry materially affect value.
-
Trade terms: quoted price may be ex-works, FOB (free on board), CIF (cost, insurance, freight), or DDP (delivered duty paid). Each term adds layers of cost that convert the benchmark into the final per-pound landed figure.
-
Contract types: spot, short-term, framework agreements with monthly indexation, or long-term fixed/float contracts. Hedging via futures or swaps is common; hedging margins and basis risk must be included in procurement math.
2. Market snapshot (early March 2026) and per-pound conversions
-
LME / global benchmark: recent LME/market feeds showed aluminum near USD 3,333 per metric ton on 4 March 2026. Converted, that equals about USD 1.51 per pound. This is the primary global signal buyers use for price negotiations.
-
United States spot (ingot): official U.S. data (USGS) reports typical U.S. spot ingot average near 130 cents per pound in 2024; U.S. buyers often pay a premium or discount versus LME depending on local scrap flows, duties, and logistics. Use the USGS spot-price series when calculating domestic landed cost.
-
China spot and local alloy quotes: Chinese primary and alloy ingot listings (SMM/SunSirs/industry bulletins) show onshore prices often in the USD 3,200–3,500 per metric ton range in early 2026, depending on alloy and delivery. Local premiums and VAT, plus inland freight, change the landed cost to exporters.
-
India: producers revise ex-works ingot prices frequently. For example, a large public producer revised primary ingot prices to around INR 339,400/tonne (≈ USD 3,692/tonne) on 1 March 2026; that equals roughly USD 1.67 per pound ex-works and excludes GST and freight. Domestic price moves can be sharper when import parity shifts
Conversion reminder: USD per metric ton ÷ 2,204.6226 = USD per pound. Example: 3,333.50 USD/tonne ÷ 2,204.6226 = ≈ 1.51 USD per lb.
3. Regional comparison table (current/representative levels)
The table below provides representative market levels near early March 2026. These are benchmark / observed regional quotes and show both USD/metric ton and USD/pound. Use these figures to calibrate procurement math; always confirm the exact quote day and incoterm.
| Region / Typical quote | Unit price (USD / metric ton) | Price (USD / lb) | Notes and delivery terms |
|---|---|---|---|
| Global benchmark (LME spot) | 3,333.50 | 1.51 | LME cash/3-month indicative level (market feed). |
| China (onshore primary / A00-range) | ~3,350 (indicative) | 1.52 | Local onshore spot for primary AL99.7, varies by region and alloy grade. Inland transport and VAT adjust landed cost. |
| India (large producer ex-works, P1020) | 3,692 (NALCO revision Mar 1 2026) | 1.67 | Ex-works price, excludes GST and freight; national revisions can shift quickly. |
| United States (typical spot ingot, 2024 reference) | ~2,860–3,000 (market band) | 1.30–1.36 | USGS spot ingot average reported at 130 cents/lb in 2024. Domestic scrap flows, tariffs, and logistics lead to a spread versus LME. |
How to use this table: start with the appropriate baseline row for your trade lane, add freight/insurance/customs (often USD 20–70/ton for major routes, larger for small lots), then add quality premia and transaction costs to get the landed USD/ton and convert to USD/lb.
4. Common ingot and alloy grades: typical pricing relationships
Aluminum pricing is not uniform. Grade, alloy additions, and permitted tolerances change value materially. The table below lists common commercial grades and typical directional premia or discounts versus a pure primary benchmark (A00 / AL99.7). These are industry-typical spreads; the exact numbers vary by time and place.
| Grade / designation | Typical relation to primary benchmark | Why |
|---|---|---|
| A00 / AL99.7 (primary high purity) | Benchmark | Used for global quotes and many contracts. |
| Primary billet (cast-cooling geometry) | small premium ±0–USD 30/ton | Value for rolling/casting customers who prefer billet geometry. |
| P1020 (India primary, 99.7%) | usually near benchmark; subject to domestic revision | Domestic producers issue monthly ex-works revisions; local policy can matter. |
| ADC12 (die-casting alloy common in China) | small premium or discount depending on Al & Si balance | ADC12 and similar alloys trade on alloy demand; automotive demand sets the tone. |
| Secondary / recycled ingot (various alloys) | discount often 5–20% depending on impurity and remelt cost | Scrap-origin metal priced lower but offers savings if alloy specs permit it. |
Practical note for engineers: if a casting line or extrusion capability tolerates some secondary content, switching to a controlled recycled alloy can reduce per-pound input cost substantially. However, downstream defects, filtration, degassing, and scrap management costs must be included.
5. Past five years: annual averages (USD/metric ton and USD/pound)
Below are yearly average price levels using public commodity datasets (IMF series via FRED and LME/monthly compilations). I compute annual values exactly from the referenced series where possible and cite those sources. These annual averages are valuable when preparing supplier benchmark spreadsheets and term contract indexes.
Annual averages, 2021–2025 (global benchmark, USD / metric ton and USD / lb)
| Year | Avg (USD / metric ton) | Avg (USD / lb) | Source notes |
|---|---|---|---|
| 2021 | 2,472.85 | 1.122 | monthly LME-derived series used to compute annual avg. |
| 2022 | 2,705.02 | 1.227 | monthly series. 2022 spike driven by tight supply and energy pressures. |
| 2023 | 2,255.74 | 1.023 | market normalization in 2023 led to a lower annual average. |
| 2024 | 2,419.02 | 1.097 | rebound in 2024 driven by restocking and shifting supply. |
| 2025 | 2,630.62 | 1.193 | quarterly IMF–FRED series used to compute 2025 average. |
How these numbers were built: monthly LME-based price series fed the 2021–2024 annual averages; the 2025 average used IMF quarterly series reported via FRED that covers the whole year. The per-pound numbers come from dividing USD/metric ton by 2,204.6226. Use these annual figures when modeling long-run contract indexation or constructing historical price charts.
6. What has driven the major swings (2021–2025)?
Concise driver map:
-
Supply-side shocks: smelter curtailments, energy cost spikes, and geopolitical export controls affect nominal supply and pushed prices higher in 2021–2022. Several regional smelter disruptions and Chinese capacity management shaped the 2022 peak.
-
Chinese policy and capacity: China is both the largest producer and the main marginal exporter. Chinese output caps, environmental controls, and longer-term industrial policy shape baseline supply. Domestic contract premiums in China can diverge from LME because of inland logistics, VAT, and alloy demand.
-
Scrap economics: recycled aluminum supplies moderate price swings but are sensitive to containerized freight and collection rates. High scrap availability reduces pressure on primary metal.
-
Macro demand: global manufacturing cycles, electric vehicle ramp, and packaging demand move aluminum demand; weak global growth prospects reduce mid-term price pressure. World Bank and financial polls in late 2025–early 2026 suggested lower commodity pressure in some scenarios.
-
Financial flows and speculation: metal funds, inventory flows into exchange warehouses, and derivative positioning amplify price moves; watch LME warehouse stats and ETF flows.
7. Five-year outlook and scenario analysis (2026–2030)
No forecast is certain, but a structured scenario approach helps procurement:
Base case (most probable): mild growth in demand for aluminum in transport and packaging; some supply-side tightening from environmental limits in parts of China; average price drifts modestly upward with volatility. Result: mid-point price level edging toward USD 2,800–3,200/ton (≈ USD 1.27–1.45/lb) over the next 12–24 months. Rationale: current market levels, IMF/FRED trend, and industry commentary.
Bull case (low probability, high impact): a series of smelter outages, tighter Chinese export policy, or stronger-than-expected EV and construction growth push a multi-year deficit. Prices could return to USD 3,400–4,200/ton (≈ USD 1.54–1.90/lb) in an extreme run. Market sentiment and speculative flows would accelerate the move.
Bear case (plausible): global demand weakens, scrap supply grows faster, and new capacity comes online, creating downward pressure. Prices could fall below USD 2,200/ton (≈ USD 1.00/lb) in a stress scenario. World Bank and some analyst polls noted downside risk tied to weak macro demand.
Useful procurement takeaway: set procurement strategy by risk tolerance: for high-volume continuous casting lines, layered hedging (part-term fixed, part-indexed) plus flexible take-or-pay schedules often outperforms blunt fixed-price long-term contracts.
8. How to select the cheapest viable aluminum ingot
-
Define acceptable chemistry and tolerances (Si, Fe, Cu, Mn limits). If your casting/extrusion tolerates more scrap, include secondary ingot quotes.
-
Specify geometry: billet vs block vs ingot affects melting yield and handling costs. Negotiate for supplier to deliver geometry you can use without expensive rework.
-
Total landed calculation: benchmark price + freight + insurance + customs + domestic handling + degassing/filtering losses. Use USD/tonne and convert to USD/lb at the end.
-
Quality control costs: include filtration performance, degassing requirements, and expected defect rate in total cost. A slightly more expensive clean ingot often lowers net cost by reducing scrap and rework. (Your company’s equipment like ceramic foam filters and degassing units often save money here.)
-
Payment and hedge terms: ask suppliers for options indexed to LME with a clear basis. Consider forward purchasing for up to 6–12 months if your margin is narrow.
-
Volume bundling: commit volumes across multiple grades to gain scale discounts. Use rolling monthly offtake rather than single-lot purchases to smooth price.
-
Audit freight lanes: compare FOB export ports, inland trucking, and rail alternatives. Small differences in freight per ton can change cost per pound materially.
-
Customs and duties: for intra-regional procurement, local duties and antidumping measures can exceed freight cost; always compute landed duty paid.
9. Tables you can paste into spreadsheets
Table A: Landed cost breakdown (example per metric ton)
| Line item | USD / ton | Notes |
|---|---|---|
| Benchmark price (LME) | 3,333.50 | market feed example. |
| Quality premium / grade cost | 30.00 | depends on alloy and mill. |
| Ocean freight (typical major lane) | 40.00 | small vessels or short distances vary. |
| Insurance and CIF add-ons | 8.00 | sample number. |
| Import duty / VAT adjustments | 60.00 | region-specific. |
| In-country transport and handling | 35.00 | depends on distance. |
| Remelt, filtration, degassing cost | 25.00 | includes yield losses. |
| Transaction costs and margins | 15.00 | financing and fees. |
| Total landed USD / ton | 3,546.50 | Example total |
| Total landed USD / lb | 1.607 | convert: 3,546.50 ÷ 2,204.6226 |
Modify each line for your route and incoterm.
Table B: Quick conversion reference
| Unit | Factor | Example |
|---|---|---|
| 1 metric ton | = 2,204.6226 lb | 3,333.50 USD/ton = 1.51 USD/lb |
| 1 lb | = 0.45359237 kg | Use to convert kg-based quotes. |
10. FAQs
Aluminium Market Quotes: 10/10 Procurement FAQ
1. What is the simplest way to convert market quotes to per-pound cost?
The standard industry conversion factor is based on the metric tonne.
Example: $3,333.50/ton / 2,204.6226 ≈ $1.51/lb
2. Should I index to LME or fix a price?
If you have predictable margins and risk appetite, use a blended strategy: part fixed to secure volumes, part LME-indexed to benefit from dips and share upside risk.
3. How much does alloy grade move price?
4. Where can I find reliable daily quotes?
5. Do Chinese domestic prices matter if I buy from Europe?
Yes. China sets the marginal global supply dynamic. Export parity and inland premiums in China (SMM prices) can shift global flows and therefore affect European import pricing and availability.
6. How much can I save by shifting to secondary ingot?
7. What are the largest line items beyond the benchmark price?
Common “hidden” costs include:
- Regional Premiums: (e.g., Midwest or Rotterdam Duty Paid)
- Logistics: Freight, duty/VAT, and inland handling.
- Metallurgical: Remelt/filtration losses and melt loss (typically 1-3%).
8. How often do Indian producer prices change?
9. Should I include hedging costs in the quoted per-pound price?
10. How to evaluate supplier quotes that show different incoterms?
11. Practical procurement playbook
-
Get daily LME or IMF feed and convert to USD/lb automatically.
-
Pull regional ex-works price lists (China SMM, India producer notices) weekly.
-
Maintain a rolling 6–12 month demand forecast and run three procurement scenarios: spot-only, blended, full-forward.
-
Capture quality and handling costs from production lines; if filtration/degassing reduces defects, calculate net benefit. (This is where equipment like AdTech filtration and degassing reduces real per-pound cost.) AdTech
-
Negotiate freight and insurance blocks with logistics partners to remove unpredictability.
12. Data transparency and source notes
-
Benchmark and market feeds: TradingEconomics (LME/market feed snapshot used for the March 2026 market point).
-
Governmental data and U.S. specifics: U.S. Geological Survey (USGS) Mineral Commodity Summaries gives ingot average U.S. spot prices and statistics; I referenced the ingot cents-per-pound table.
-
Regional producer notices: NALCO revision note provided the Indian ex-works price used in regional table.
-
Historical monthly series: indexmundi / LME monthly series were used to compute 2021–2024 annual averages.
-
IMF / FRED quarterly series: used for robust 2025 average and trend context.